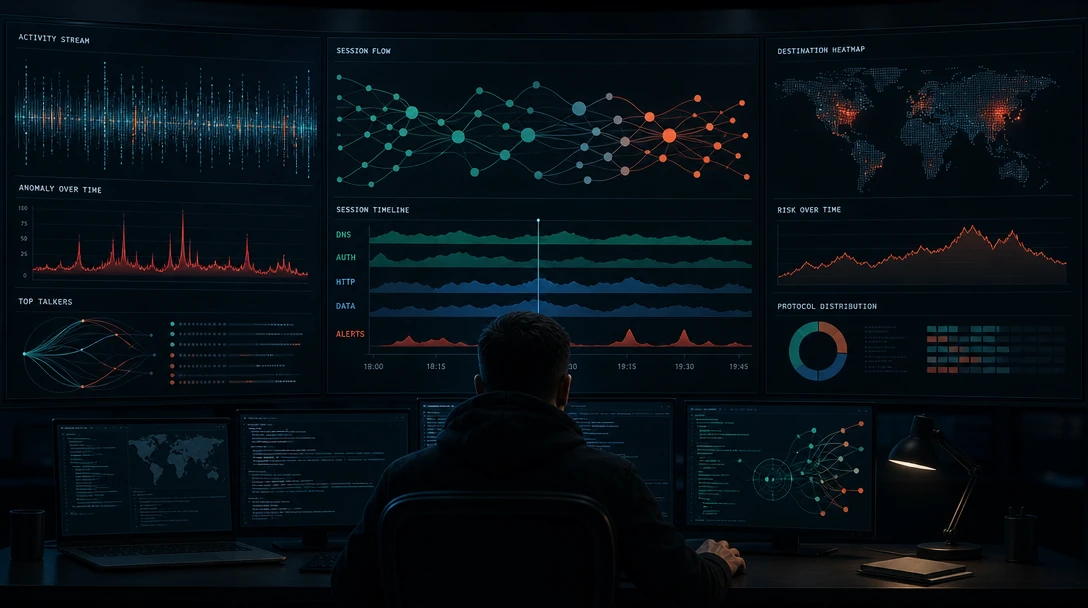
TL;DR: AI agent runtime monitoring is the practice of continuously observing what a coding agent actually does once it is live: which tools it calls, what data and credentials it touches, and how that behavior compares to an established baseline. Unlike APM or pre-deployment testing, it answers the operational question "is this agent behaving as intended right now" and feeds a SOC triage workflow that routes only meaningful deviations, not raw activity volume, to an on-call analyst.
An engineer hands an AI coding agent shell access, a GitHub token, and a task. Over the next ninety minutes that agent might read forty files, call a package manager a dozen times, open three pull requests, and query an internal API it has never touched before. Somewhere in that stream sits either normal engineering work or the first move of a prompt injection that plants a persistence mechanism for later. Distinguishing the two in real time, at production scale, across dozens of developers running Claude Code, Codex, and Cursor sessions concurrently, is the operational job of AI agent runtime monitoring.
This article is written for the security and platform engineers who own that job day to day: how to build a behavior baseline, which signals actually deserve an alert, how a triage workflow should move from detection to closure, and who on your team should hold the pager when an agent does something it shouldn't.
Table of Contents
- What Is AI Agent Runtime Monitoring?
- Why AI Coding Agents Raise the Monitoring Stakes
- Why APM and Pre-Deployment Testing Can't Answer the Runtime Question
- From Per-Session Alerts to Cross-Session Risk Lineage
- Building a Behavioral Baseline and Choosing Signals That Matter
- SOC Triage Workflow: From Alert to Resolution
- Dashboards, SIEM Routing, and On-Call Ownership
- FAQ
What Is AI Agent Runtime Monitoring?
AI agent runtime monitoring is the continuous observation of an agent's live tool calls, data access, and reasoning transitions against an established behavioral baseline, so that deviations trigger investigation instead of passing unnoticed. It runs after deployment, on the actual agent process, not against a test suite or a staging log.
It is commonly confused with two adjacent practices:
- Application performance monitoring (APM) and general observability: these track uptime, latency, token spend, and error rates. Useful for reliability, but they don't evaluate whether an agent's actions align with the task it was given.
- Pre-deployment testing and evaluation: this checks whether an agent passes a fixed set of test cases before release. It says nothing about what the same agent does three weeks into production against data and prompts it was never tested on.
- Endpoint and network security monitoring: this watches the host and the wire. It doesn't parse an agent's tool-call sequence or reasoning path, so it can miss an agent that stays within normal network patterns while quietly escalating scope inside its own session.
Why AI Coding Agents Raise the Monitoring Stakes
Coding agents raise the monitoring stakes because they act autonomously across many steps and multiple sessions, with standing access to source control, shells, and internal tooling, which turns a single successful manipulation into a multi-step campaign rather than a one-off bad output. A human developer who clicks a malicious link causes one incident. An agent that ingests a poisoned file, a manipulated pull request comment, or a compromised MCP server response can act on that manipulation across dozens of subsequent tool calls without anyone re-reading the original input.
Two risk patterns matter most in practice:
- Memory poisoning and prompt injection through developer artifacts: a comment in a GitHub issue, a docstring, or a config file can carry instructions an agent will treat as legitimate context. Because coding agents routinely ingest untrusted repository content, this is a wider attack surface than a chat interface.
- Long-horizon, cross-session persistence: an agent might plant a dependency, a cron entry, or a modified script during one session that only becomes an unsafe action when a later session (sometimes a different agent, days apart) picks it up and executes it.
Runtime control infrastructure like Gensee Crate records each tool call against the session and agent that made it, so a later action can be traced back to the earlier step that set it up.
Regulatory and governance frameworks have started to reflect this shift. Microsoft's Cloud Adoption Framework guidance on AI agent governance states that leaders must know which agents exist, who owns them, what they can access, and how to intervene when behavior falls outside policy, and it recommends routing AI-related alerts into the SOC with defined thresholds. As of mid-2026, NIST's AI Risk Management Framework remains voluntary, but its generative AI profile (issued July 2024) and its later work on critical-infrastructure use cases signal that continuous behavioral oversight, not just pre-release testing, is becoming the expected baseline for agentic systems.
Why APM and Pre-Deployment Testing Can't Answer the Runtime Question
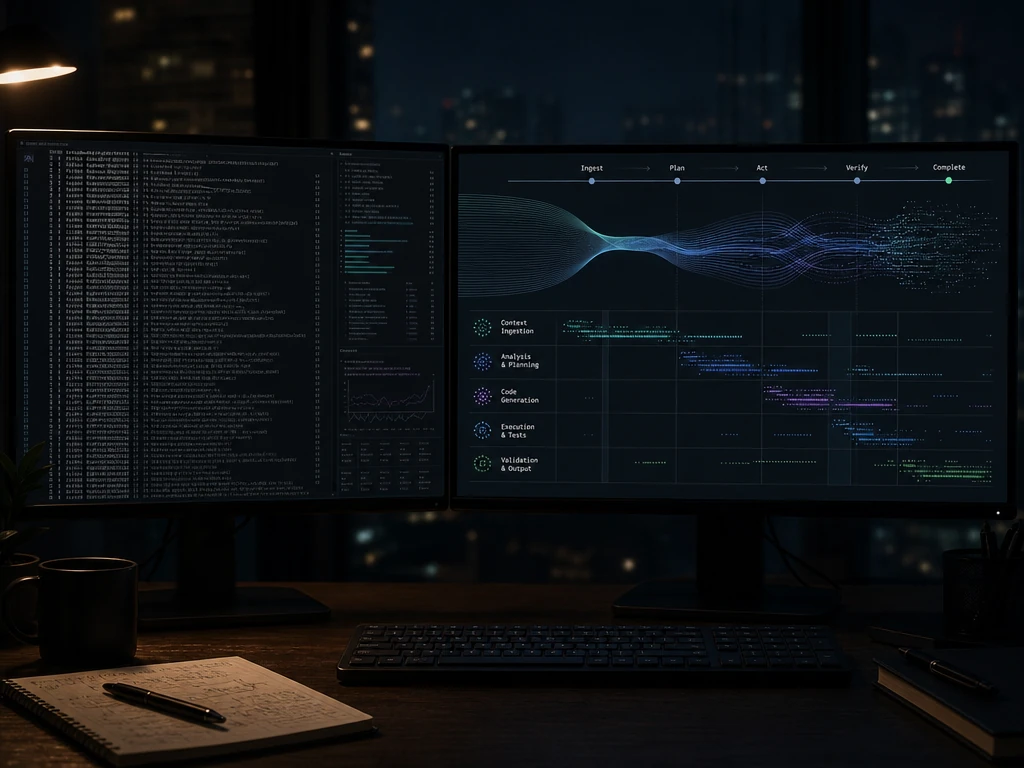
APM and pre-deployment testing were both built to answer different questions than "is this agent's live behavior aligned with intent," so bolting runtime alerts onto either one leaves the actual behavioral question unanswered. It isn't that these tools are weak; they are scoped to reliability and to fixed test cases, neither of which covers open-ended, in-production agent decisions.
| Dimension | APM / General Observability | Pre-Deployment Testing | Runtime Behavior Monitoring |
|---|---|---|---|
| Core question | Is the system up and fast? | Did it pass the checks we designed? | Is it behaving as intended right now? |
| When it runs | Continuously, post-deployment | Before release | Continuously, post-deployment |
| What it evaluates | Latency, errors, cost, uptime | Fixed scenarios and test cases | Live tool calls, data access, sequence drift |
| Blind spot | Can't judge intent alignment | Can't see novel production inputs | N/A, but scoped to what's instrumented |
This distinction matches what security vendors observing agentic workloads have converged on. Sweet Security's analysis of AI runtime monitoring puts it directly: standard APM and observability track uptime, latency, and cost, but runtime monitoring evaluates whether live agent reasoning, tool calls, and data access align with intended behavior, and it separates that from pre-deployment testing by framing the latter as answering "did it pass the checks we designed" against runtime validation's "is it behaving as intended right now."
From Per-Session Alerts to Cross-Session Risk Lineage
Runtime monitoring that evaluates each session in isolation still has a scope limit: it can flag an anomalous tool call inside a single session but can't natively connect a persistence artifact planted in session one to the unsafe action a different session takes on it in session five. That gap matters most for coding agents, which routinely span multiple sessions, multiple days, and sometimes multiple agent tools working against the same repository.
Consider a concrete sequence: a Codex session ingests a manipulated dependency file and, following injected instructions, adds a script to a build hook. Nothing in that session looks catastrophic on its own; it resembles ordinary build configuration. Three days later, a Claude Code session in the same repository triggers that build hook during an unrelated task, and the planted script exfiltrates a credential. A monitoring system that only evaluates each session against its own baseline will likely miss the link between the two events, because neither session in isolation crosses an obvious threshold.
This is the specific gap that has pushed runtime control infrastructure such as Gensee Crate Enterprise toward defense that spans full multi-step, multi-session work rather than single prompts or single sessions, correlating planted persistence with the later action that exploits it. In practice, we find that treating a coding agent's work as a sequence of independent, disposable sessions is the assumption that most consistently produces missed detections, precisely because the exploit is designed to look uneventful at each individual step.
Building a Behavioral Baseline and Choosing Signals That Matter
A useful agent baseline captures which tools an agent calls, in what order, against which data, and how often, so that a call it has never made or a frequency spike outside its normal pattern registers as measurable drift rather than a guess. Building that baseline, and then deciding which deviations deserve an alert, is the core operational work of runtime monitoring.
What to capture in the baseline
OWASP's AI Agent Security Cheat Sheet recommends logging structured decision metadata for high-risk actions, including the action classification, a risk score where applicable, the authorization outcome, the approval identifier, the execution result, and the policy version in force at the time. For coding agents specifically, that baseline should track:
- Tool and API invocation patterns: which commands, package managers, and internal services get called, and in what sequence.
- Data access patterns: which repositories, secrets stores, and internal APIs the agent reaches, and whether that access matches its assigned task.
- Identity and permission use: whether the agent operates within its granted scope or attempts privilege escalation.
- Reasoning transitions: sudden shifts in the agent's stated plan that don't map to the task it was given.
Thresholds that separate signal from volume
Alerting on raw activity volume drowns a SOC in noise, because a normal coding agent session can legitimately generate hundreds of tool calls an hour. OWASP's cheat sheet offers illustrative examples worth adapting rather than adopting verbatim: a tool-call rate around 30 per minute, roughly 5 failed tool calls, a single detected injection attempt, about 3 sensitive-data-access events, and a cost ceiling near $10 per session as thresholds worth reviewing. The specific numbers should be tuned per agent and per team, but the pattern holds: rate, failure count, and cost per session are more useful triggers than absolute call volume.
Acalvio's runtime-first analysis of agentic AI security adds a distinction worth keeping in mind: continuous login activity and a high API request volume are often normal for an agent, where they would be suspicious for a human user, so resource access has to be evaluated against the assigned task rather than against a static rate. Acalvio also flags one of the highest-confidence signals available: any interaction with a deceptive asset, a canary token, a honeytoken, or a honeypath indicates the agent has exceeded its intended scope, because no legitimate task ever has a reason to touch one.
SOC Triage Workflow: From Alert to Resolution
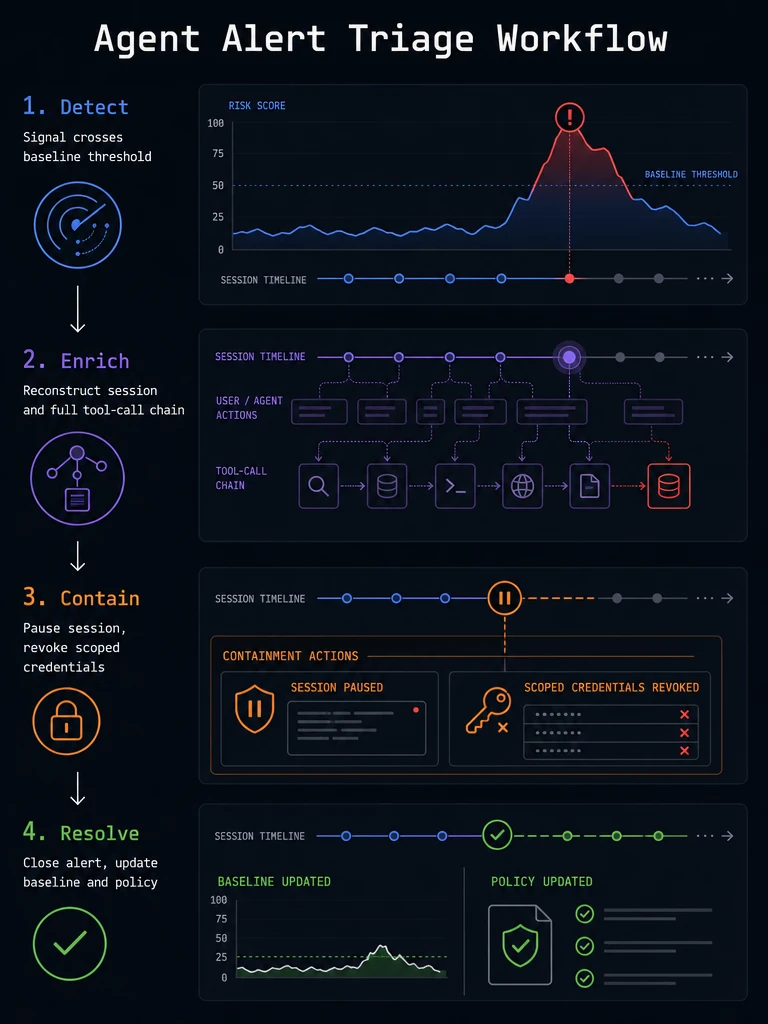
An agent alert should move through four stages: detection against the baseline, enrichment that reconstructs the full session and tool-call chain, containment that limits what the agent can still do, and resolution that feeds the outcome back into the baseline and policy. Skipping enrichment is the most common failure mode we've seen; without the full chain, an analyst is left judging a single tool call with no context for what led to it.
Detect and enrich
Detection fires when a signal crosses its threshold: an unfamiliar tool call, a failed authorization, a canary-token hit, or a sequence that departs from the agent's established pattern. Enrichment immediately pulls the surrounding context: the agent's identity, the session and any linked prior sessions, the full tool-call chain leading up to the flagged action, and the policy version that was active.
Contain and capture evidence
For actions that are destructive, financial, administrative, or externally visible, OWASP recommends that a policy or execution component independently validate scope, privilege, and approval state before the action completes, rather than trusting the agent's own request. In practice this means the containment step should be able to pause the session, revoke a scoped credential, or isolate the workspace the agent was operating in, while preserving the state for forensic review rather than terminating it outright.
Resolve and feed back
Closure records whether the alert was a true positive, an approved exception, or baseline noise, and that outcome should adjust the threshold or the baseline going forward. Microsoft's governance guidance recommends starting with an audit-based model that observes behavior and identifies patterns before introducing stricter automated controls, which is a reasonable posture for teams still tuning their thresholds.
Tip: Decide your containment actions before you need them. Microsoft's guidance specifically recommends knowing in advance how to quickly disable a malfunctioning or harmful agent and running drills for agents that support critical operations, rather than improvising during a live incident.
Dashboards, SIEM Routing, and On-Call Ownership
A security leader's agent dashboard should answer three questions at a glance: which agents are active and what can they reach, what's their current deviation from baseline, and which alerts are open versus resolved. Layering that on top of raw activity counts creates noise instead of clarity, so the dashboard's job is to surface trend and exception, not volume.
What belongs on the dashboard
- Coverage by agent and by developer environment: which coding agents (Claude Code, Codex, Cursor, and others) are instrumented, and which are running unmonitored.
- Policy-denial and approval-bypass trends: drift in approval behavior and repeated bypass attempts are explicitly called out by OWASP as signals worth tracking over time, not just as one-off events.
- Risky tool-chain sequences: chains that combine data access with an external call, or privilege escalation followed by a write action.
- Time-to-triage and time-to-contain: operational metrics that tell you whether your workflow, not just your detection, is keeping pace.
Routing to the SIEM and assigning the pager
Microsoft's guidance recommends that AI-related alerts flow into the existing SOC pipeline, using defined thresholds for anomalies like latency spikes or unauthorized access attempts, and, in Microsoft's own environment, routing through Azure Monitor Alerts into Microsoft Sentinel via Log Analytics as one example integration path (accurate as of Microsoft's published guidance in 2026; confirm current defaults before relying on them). The underlying principle applies regardless of SIEM vendor: agent alerts should land in the same triage queue as every other security signal, correlated with identity and endpoint data, not siloed in a separate AI tool that the SOC never opens.
Ownership tends to split across four groups, and being explicit about the split before an incident happens is what keeps the workflow from stalling:
- Platform or developer-experience engineering owns instrumentation: making sure every coding agent in use is actually emitting the telemetry above.
- The SOC owns triage and containment for alerts that cross a security threshold.
- Identity and access management owns the credential and scope decisions that containment actions depend on.
- Incident response owns the post-incident review and the baseline or policy update that follows.
This is also where mandatory mediation matters operationally: high-risk actions (merging to a protected branch, writing to a secrets store, calling an external endpoint) should require independent validation before execution completes, rather than relying on the agent's own request as sufficient authorization. That is the effect evidence a SOC analyst actually needs during triage: not just that an action was attempted, but that it was validated, approved, or blocked by a component the agent doesn't control.
This is also where the mechanics of the runtime layer start to matter for coverage. A monitoring approach that runs as a sidecar alongside unmodified coding agents, rather than requiring an SDK rebuild of each agent, is what makes it realistic to instrument Claude Code, Codex, and Cursor side by side without asking every team to re-platform. And because agent work sometimes needs to be paused, inspected, and either merged or discarded rather than simply allowed or blocked, live workspace forks that let a team fork a session, inspect what it did, and roll it back if it doesn't check out give the containment step in the triage workflow above an actual mechanism to act on, instead of a binary kill switch. Teams evaluating that kind of coverage can review the open-source components on Gensee's GitHub or check the FAQ for common deployment questions.
If your current setup can detect an anomaly but has no clean way to contain it without killing the whole session, that gap is worth walking through with someone who builds this daily. You can book a demo to see how a sidecar-based runtime layer fits into an existing SIEM and identity stack.
FAQ
What is AI agent runtime monitoring in one sentence?
AI agent runtime monitoring is the continuous, post-deployment observation of an agent's tool calls, data access, and reasoning behavior against an established baseline, so meaningful deviations trigger investigation instead of passing unnoticed. It is distinct from APM, which tracks uptime and latency, and from pre-deployment testing, which only checks fixed scenarios before release.
How is AI agent runtime monitoring different from APM?
APM and general observability track uptime, latency, error rates, and cost, which tells you whether the system is healthy but not whether the agent's actions match its intended task. Runtime behavior monitoring specifically evaluates tool-call sequences, data access, and reasoning transitions against a behavioral baseline to catch drift that a purely operational metric would never surface.
What signals matter most for monitoring AI coding agents?
The highest-value signals are tool and API invocation patterns, data access against sensitive repositories or secrets stores, identity and permission use relative to the agent's assigned scope, and abrupt reasoning transitions. Interaction with a deceptive asset such as a canary token or honeypath is a particularly high-confidence signal, since no legitimate task ever has a reason to trigger one.
Who should own AI agent monitoring alerts, the SOC or the platform team?
Ownership typically splits: platform or developer-experience engineering owns instrumentation and coverage, the SOC owns triage and containment once an alert crosses a security threshold, identity and access management owns the credential decisions containment depends on, and incident response owns the post-incident policy update. Defining that split before an incident happens is what keeps triage from stalling on "whose alert is this."
How does runtime monitoring handle multi-step or long-horizon agent sessions?
Monitoring that evaluates each session independently can miss an attack where a persistence artifact planted in one session is only executed by a later, separate session, sometimes days apart or by a different agent. Addressing that requires linking risk lineage across sessions rather than resetting the baseline at every session boundary, which is the specific gap that cross-session, long-horizon defense approaches are built to close.
Conclusion
AI agent runtime monitoring for coding agents comes down to five operational disciplines: building a baseline of normal tool use, tuning alerts around rate and failure signals instead of raw volume, running a triage workflow that enriches before it contains, routing alerts into the SIEM your SOC already trusts, and assigning clear ownership before an incident forces the question. None of that requires ripping out APM or your existing testing pipeline; it requires adding the layer that watches what the agent actually does once it's live, including across the sessions where the real damage tends to land.
If your team is instrumenting Claude Code, Codex, Cursor, or similar agents and finding the containment step is the weak link, it's worth comparing notes with an engineer who works on this daily. Book a demo to walk through how sidecar-based runtime monitoring and live workspace forks fit your stack, or drop into our Discord to see how other teams are structuring their triage workflow.