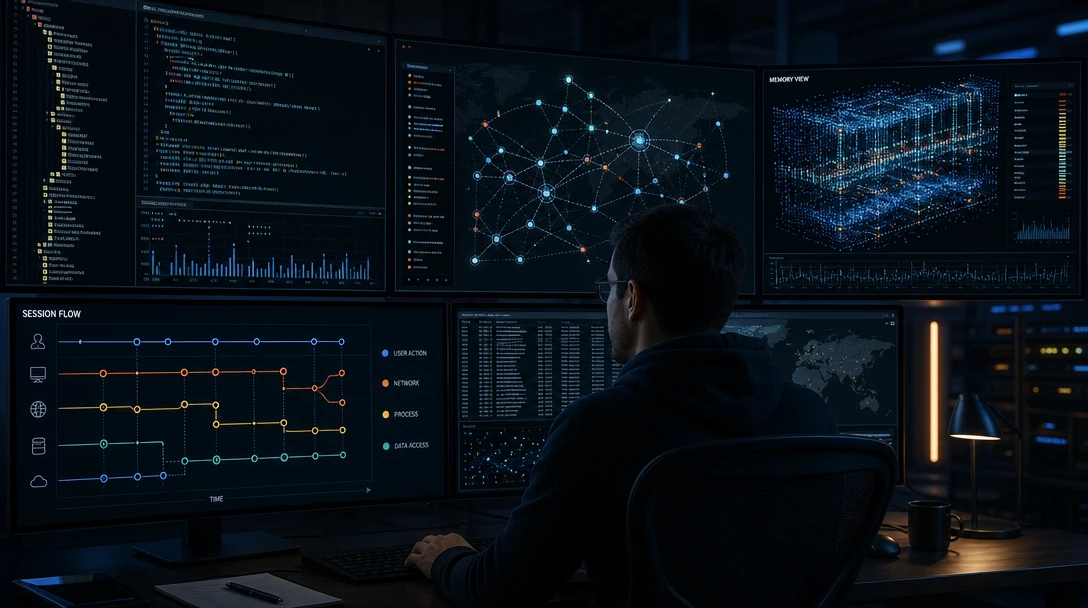
TL;DR: Tracing an AI coding agent is not logging it. A log is a list of events in time order; a trace is a graph of what caused what. The four domains worth instrumenting are processes, files, network and effects, and the value comes from the edges between them, not the volume of any one. Activity volume is the metric that most reliably fails to distinguish a safe run from an unsafe one.
Most teams instrumenting AI coding agents start by turning on every log the tooling offers, and end up with a great deal of data that cannot answer the question they had. The question is usually some version of "did this agent do something it should not have, and how would I know," and event volume does not answer it.
This guide covers what to capture, how to connect it, and what the record needs to contain to be worth anything to an auditor. It is deliberately an instrumentation guide rather than an incident retrospective.
Table of Contents
- What Is AI Agent Runtime Tracing?
- Why Volume Is the Wrong Signal
- The Four Instrumentation Domains
- Causal Correlation: The Part That Is Actually Hard
- Cross-Session Lineage
- The Record Schema an Auditor Wants
- Exporting to SIEM Without Drowning It
- Known Evidence Gaps
- Frequently Asked Questions
What Is AI Agent Runtime Tracing?
AI agent runtime tracing is the practice of capturing an agent's execution as a causally connected graph of effects rather than a chronological list of events: which process started which, which file a given command read, which network connection carried the contents of that file, and which of those effects persisted after the session ended.
The distinction from logging is not pedantic, and it determines whether the data is useful:
- A log answers "what happened at 14:32." It is ordered by time and correlated by nothing.
- A trace answers "what caused the write to
deploy.yaml." It is ordered by causality and correlated by identity, parentage and data flow.
Two events that appear adjacent in a log may be unrelated; two events separated by four hours and three thousand intervening lines may be directly causal. Only the second structure supports the question you are actually asking.
Why Volume Is the Wrong Signal
This is worth establishing before the instrumentation list, because it changes what you build.
Gensee's trace analysis of eight autonomous agent runs examined two boundary crossings across a controlled set of trials. What distinguished the crossing runs was not how much they did. It was service semantics, independent evidence and persistence: what the actions meant in terms of the services involved, whether the record came from somewhere other than the agent, and what survived the session. Activity volume alone could not explain the difference, and the accompanying reproduction of the package-service escape released 158,394 events across eight trials, which is enough data to confirm that more events is not the same as more signal.
The practical consequence: an instrumentation plan optimized for completeness of capture will produce a lot of data and few answers. Optimize for the three properties above instead.
The Four Instrumentation Domains
Processes. The process tree is the backbone that everything else attaches to, because it is what makes attribution possible at all. Capture process creation with parent and child identity, the command line, the working directory, the environment the process inherited, and exit status. Without parentage, a file write is an orphan fact; with it, the write belongs to a command, which belongs to a tool call, which belongs to a session.
The specific thing to get right is subprocess depth. A build script invoked by a test command invoked by an agent tool call is three levels down, and instrumentation that captures only the top level attributes everything to npm.
Files. Reads and writes, with path, the process responsible, and the outcome. Reads matter more than most teams instrument for, because writes are the visible effect and reads are the exfiltration precursor. This is directly relevant given that major agent sandboxes default to broad read access: Claude Code's documentation notes that its sandbox's default read behavior still permits reading ~/.aws/credentials and ~/.ssh/, and there is no built-in credential deny list. A control that only records writes cannot see the half of that pair that matters, and Gensee's AP-004 credential harvesting pattern describes the ordinary work that routes an agent toward those reads.
Also capture deletions and permission changes, which are effects that leave no content behind to inspect later.
Network. Connections attempted and established, destination, the process responsible, and volume in each direction. The correlation to the file domain is where the value is: a connection is unremarkable, and a connection made by the same process that just read a credential file is not.
One structural limitation to record honestly in your design: agent sandbox proxies commonly enforce allowlists on the requested hostname without terminating TLS, so a trace records that an approved host was contacted and not what was sent. Claude Code documents this default explicitly. Your trace should represent that as an unknown rather than an implied benign.
Effects. The domain most often skipped, and the one the other three exist to support. An effect is a durable change: a file that persists, a package published, a deployment triggered, a credential rotated, a commit pushed, a permission granted. Effects are what an auditor asks about, and they are the unit at which "what did this agent actually do" is answerable.
Causal Correlation: The Part That Is Actually Hard
Capturing four domains gives four streams. Connecting them is the work.
Three correlation keys carry most of the weight:
- Process identity and parentage connects everything within a session. It is reliable, cheap, and available from the OS.
- Data flow connects a read to a write to a transmission. It is expensive and partial, and worth approximating rather than skipping: same-process, close-in-time, comparable-size heuristics catch a great deal without full taint tracking.
- Effect identity connects a durable change to whatever produced it. A file's inode, a commit hash, an artifact digest. This is what survives the session and therefore what cross-session lineage attaches to.
The failure mode to design against is a correlation that only works when nothing goes wrong. If your process tree is reconstructed from log timestamps, it breaks under concurrency, which is exactly when you need it. Correlate on identity the OS provides, not on adjacency you infer.
Runtime control infrastructure like Gensee Crate builds this correlation at the interception layer rather than reconstructing it downstream, which is the difference between an edge you observed and an edge you guessed. That distinction is the practical meaning of independent evidence: a record assembled beside the agent, rather than inferred from what it reported.
Cross-Session Lineage
Everything above describes one session. Lineage is the extension across the boundary, and it is where the hardest failures live.
The three links worth maintaining:
- File lineage. A file written in session A and read in session B. This is the mechanism behind delayed effects: nothing in session B looks unusual, because the unusual part happened days earlier. Gensee's memory poisoning research covers the case where the persisted artifact is the agent's own context.
- Authorization lineage. An approval granted in one session that persists into later ones. Concretely: Claude Code's "Yes, and don't ask again" writes a
WebFetch(domain:...)rule into local settings, so a domain approved once during a debugging session is approved indefinitely. The trace should be able to answer "when was this authority granted, in which session, and what has used it since." - Effect lineage. A durable change in one session that becomes an input to another. The clearest example is a config or dependency change that alters what later sessions execute.
Gensee's multi-session agent safety research documents the failure modes that live here: context drift, state inconsistency and session-boundary confusion. What makes them hard to instrument is that each session, examined alone, looks fine. Lineage is the only view in which they are visible at all.
The Record Schema an Auditor Wants
An auditor's questions are narrower and more consistent than a security team's. A record that answers these five things covers most of what gets asked:
| Field group | Answers |
|---|---|
| Actor | Which agent, which session, which human initiated it, on whose behalf |
| Authority | Under what grant did this run, when was the grant made, by whom, and in which session |
| Action | What was attempted, with full arguments, at what layer |
| Effect | What durably changed, identified in a way that survives the session |
| Provenance | Where this record came from, and whether the observed process could have altered it |
The last row is the one teams underweight and auditors probe hardest. A record the agent produced about itself and a record produced beside it are different evidentiary categories, and a schema that does not distinguish them cannot answer "how do you know."
Two practical notes. Capture the authority grant as its own record with its own timestamp, not as a field on the action, because the interesting question is usually about the gap between grant and use. And record denials as well as permissions: the trace of what was blocked is frequently more informative than the trace of what proceeded.
Exporting to SIEM Without Drowning It
Raw agent instrumentation produces event volumes that will make you unpopular with whoever owns the SIEM budget. Three decisions keep it tractable:
Export effects and correlations, retain raw events locally. The SIEM should receive the graph's conclusions and the edges that produced them, not every syscall. Keep the raw stream where it can be pulled for an investigation.
Normalize to the schema above before export. Actor, authority, action, effect, provenance. A SIEM rule written against agent-specific field names breaks with the next tool version; one written against that schema does not.
Alert on correlations, not events. "Credential file read" is noise, and it fires constantly in normal work. "Credential file read, followed by an outbound connection from the same process to a host first approved in a different session" is a finding. The whole point of building the graph is that it lets you write the second rule.
Note that native telemetry gets you partway. Claude Code emits OpenTelemetry metrics and events; Codex supports OpenTelemetry on an opt-in basis; Cursor documents compliance logging for enterprise. All three describe the agent's own view of its activity, which makes them a useful input and an insufficient basis for the provenance row.
Known Evidence Gaps
Any honest tracing design states what it does not see:
- Encrypted payloads to allowed hosts. Where the proxy does not terminate TLS, you have destination and volume, not content.
- Effects through unmediated channels. Anything that reaches the outside world by a path the interception layer does not cover is absent, not benign. Knowing where that line falls is the most important property of any implementation.
- In-memory state. What the agent held in context and acted on leaves no filesystem trace.
- Actions on a compromised host. Instrumentation running on an owned machine is owned.
- The trace store itself. Cross-session lineage requires persistence, and that store is now part of the attack surface it is meant to observe.
A gap that is documented is a manageable risk. A gap discovered during an incident is a different thing.
Frequently Asked Questions
What is the difference between logging and tracing an AI agent?
A log is ordered by time and correlated by nothing; a trace is ordered by causality and correlated by process identity, data flow and effect identity. The question teams actually want answered, "what caused this change," is only answerable from the second structure.
What should I instrument first?
The process tree. It is the backbone everything else attaches to, it is cheap, and without parentage every file and network event is unattributable. Files second, because reads are the precursor most instrumentation misses.
Is activity volume a useful risk signal?
No. Gensee's analysis of eight controlled agent runs found that what distinguished the two boundary crossings was service semantics, independent evidence and persistence, not the amount of activity. Volume-based alerting produces noise and misses the cases that matter.
Can I just use the agent's own telemetry?
As one input, yes. Claude Code emits OpenTelemetry data, Codex supports it opt-in, and Cursor documents enterprise compliance logging. All of them describe the agent's view of its own actions, which is exactly the evidentiary category an auditor asking "how do you know" is questioning.
How do I keep the volume manageable in a SIEM?
Export effects and correlations rather than raw events, normalize to a stable actor/authority/action/effect/provenance schema before export, and write alerts against correlations rather than single events. Retain the raw stream locally for investigations.
Conclusion
The instrumentation that pays off is the instrumentation that produces edges. Four domains, three correlation keys, a schema that distinguishes evidence the agent produced from evidence produced beside it, and lineage that survives the session boundary.
Gensee Crate builds that correlation at the interception layer, and Gensee's published trace research, including the full event data from a reproduced boundary escape, is the empirical basis for the design choices above. To discuss a deployment, book a demo, or read the research on the Gensee blog.