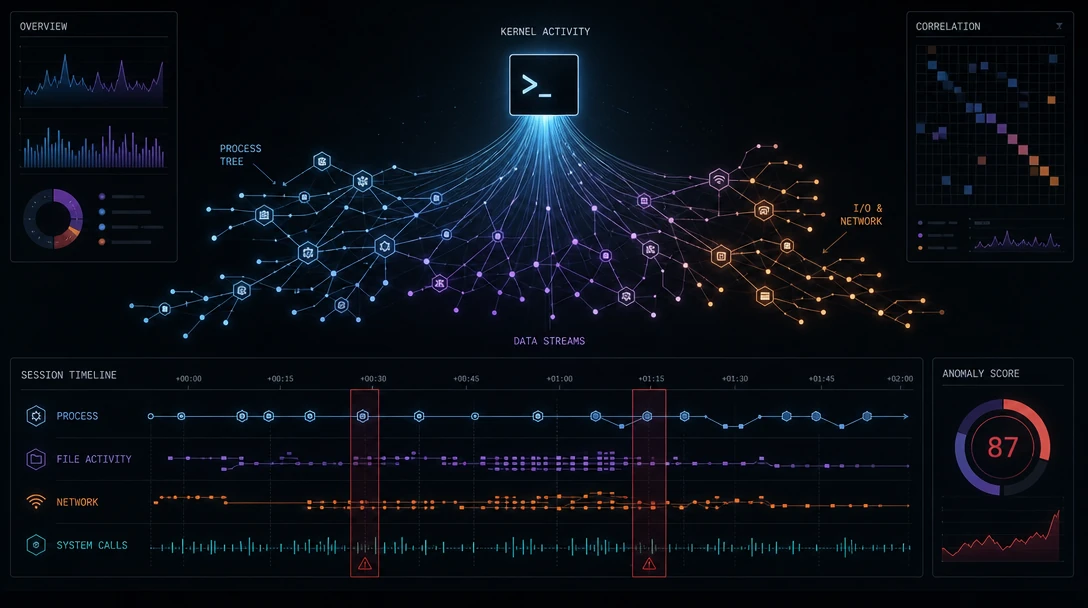
TL;DR: AI agent runtime tracing is OS-level observation of what a coding agent's processes actually do: which files they touch, which binaries they spawn, and which network connections they open, correlated back to the LLM intent that triggered each action. It's distinct from application logging (which records events without execution context) and from LLM/agent observability traces (which record prompts and tool calls but stop at the process boundary). Causal correlation between "what the model said" and "what the operating system did" is what lets defenders catch multi-step attacks that neither layer can see alone.
A coding agent asks to read a configuration file. Thirty seconds later, a subprocess it spawned opens an outbound connection to a domain nobody on the team recognizes. Nothing in the agent's chat transcript looks wrong: the prompt was reasonable, the tool call was authorized, the model's stated reasoning was benign. The attack lives in the gap between what the agent said it would do and what its processes actually did on the machine. That gap is exactly what AI agent runtime tracing exists to close, and it's a different discipline from the LLM observability tooling most teams already run.
Table of Contents
- What Is AI Agent Runtime Tracing?
- Why Logs and LLM Traces Can't Answer This Question Alone
- How AI Agent Runtime Tracing Actually Works
- Why Causal Correlation Matters for Long-Horizon Agent Risk
- Runtime Tracing in Enterprise Coding Agent Environments
- Implementing Runtime Tracing Without Rebuilding Your Agent Stack
- FAQ
What Is AI Agent Runtime Tracing?
AI agent runtime tracing is the practice of capturing an agent's operating-system-level behavior, its processes, file access, and network activity, and linking that behavior back to the LLM prompt or response that caused it. Unlike a chat transcript, a runtime trace tells you what actually executed on disk and on the wire, not just what the model claimed it would do. It answers a narrow, concrete question: "given this LLM output, what did the underlying system actually do, and is that causally connected?"
It's easy to confuse this with two adjacent concepts:
- Application logging records discrete events (a request came in, a file was written) but rarely carries the execution context needed to tie one event to another, let alone to a specific model decision.
- LLM/agent observability tracing (the kind of tracing tools like LangSmith or Arize provide) captures prompts, tool calls, and model outputs, but its visibility typically ends at the agent's own process boundary; it doesn't see what a shell command or subprocess does once the operating system takes over.
- Runtime security monitoring (tools like Falco) watches kernel events for known-bad patterns, but on its own has no notion of "which agent, driven by which prompt, caused this."
Runtime tracing sits underneath all three: it's the layer that observes actual process trees, file writes, and socket activity, and it's the layer capable of causally correlating that activity with agent intent rather than merely logging it as an isolated event.
Why Logs and LLM Traces Can't Answer This Question Alone
Application logs and LLM observability traces aren't inadequate tools; they're built to answer different questions than "did this agent's system-level effects match its stated intent." Logs are scoped to discrete application events, and LLM traces are scoped to the agent's own reasoning and tool-call surface. Neither was designed to look past the process boundary into what the kernel actually did.
The OpenTelemetry specification notes this gap directly for logs: log records typically lack a standardized way to carry trace context, so correlating a log entry with the request (or agent action) that produced it depends on whatever ad hoc timestamp or origin field happens to be present. System-level logs in particular "either do not include any data about the trace context or if included it is highly idiosyncratic," which is precisely the correlation problem runtime tracing exists to solve.
Agent-level observability tracing has a parallel but distinct scope limit. As Gravitee's engineering team describes it, agent tracing "emits and correlating distributed trace spans for every AI agent invocation, including calls to LLMs, MCP tools, and other agents," capturing agent identity, tool name, inputs, outputs, and policy decisions at the gateway or SDK layer. That's valuable for understanding an agent's decision path, but it's instrumented at the application layer; it has no visibility into what a spawned shell process, a written file, or an outbound connection actually did once code execution left the traced application.
| Dimension | Application Logs | LLM/Agent Observability Traces | OS-Level Runtime Tracing |
|---|---|---|---|
| What it captures | Discrete events per component | Prompts, tool calls, model outputs | Process trees, file access, network syscalls |
| Correlation with intent | Rarely, unless manually instrumented | Strong, within the agent's own boundary | Strong, across process boundaries |
| Blind spot | No execution context | Stops at spawned subprocesses | None at the system level, but needs the intent stream to interpret "why" |
| Resilience to code/API changes | Depends on manual instrumentation | Breaks when agent frameworks change | Framework-agnostic, since it observes the kernel, not the SDK |
The practical implication: an agent security posture that relies only on logs or only on agent-level tracing has a structural blind spot exactly where multi-step attacks like memory poisoning and prompt injection tend to hide, in what happens after the model's response leaves the traced application and becomes shell commands, file writes, or network calls.
Runtime control infrastructure like Gensee Crate works at this layer, recording which spawned process touched which file or opened which connection and tying that activity back to the agent session that launched it.
How AI Agent Runtime Tracing Actually Works
Runtime tracing works by capturing kernel-level events with low-overhead instrumentation, then causally linking those events back to the LLM intent that likely produced them. The collection side and the correlation side are two separate engineering problems, and both matter.
Kernel-Level Collection with eBPF
Most modern runtime tracing is built on eBPF, a Linux kernel technology that runs sandboxed, event-driven programs directly in kernel context without requiring kernel source changes or module recompilation. eBPF programs attach to hook points such as system calls, function entry and exit, and network events, then write structured data into maps that user-space tooling can read. Because eBPF programs are verified to always terminate and typically don't require modifying the traced application at all, this collection method is instrumentation-free from the agent's point of view: it works against unmodified binaries and survives rapid changes to an agent framework's internal APIs.
This is also the mechanism runtime security tools like Falco use for detection: Falco parses Linux syscalls at runtime and asserts them against a rules engine, watching for patterns like unexpected writes to system directories or unexpected outbound connections. As of early 2026, Falco's default collection driver is a modern eBPF probe rather than a kernel module, reflecting the broader industry shift toward eBPF for this kind of low-level visibility. The Linux kernel's own Landlock sandboxing subsystem takes a related approach, emitting trace events for sandbox lifecycle operations and access denials that can be consumed by eBPF programs for programmatic introspection, with correlation IDs that let a consumer reconstruct which sandbox decision produced which denial.
Causal Correlation: Turning Events Into a Story
Collection alone isn't enough. A raw eBPF event stream tells you a process wrote a file; it doesn't tell you an agent's LLM response caused that write. Research published on runtime tracing for AI agents (the AgentSight project) frames this as a two-stream correlation problem: intercepting the agent's LLM traffic to extract semantic intent, monitoring kernel events to observe system-wide effects, and then causally correlating the two streams across process boundaries in real time.
That correlation typically combines three mechanisms:
- Process lineage: tracking fork and execve events to build a complete process tree, so an action taken by a spawned child process can be traced back to the parent agent that launched it.
- Temporal proximity: associating system actions that occur within a narrow window (AgentSight's published research uses roughly 100 to 500 milliseconds) immediately following an LLM response.
- Argument matching: directly matching content from the LLM's response, such as a filename, URL, or shell command, against the arguments of the system calls that follow.
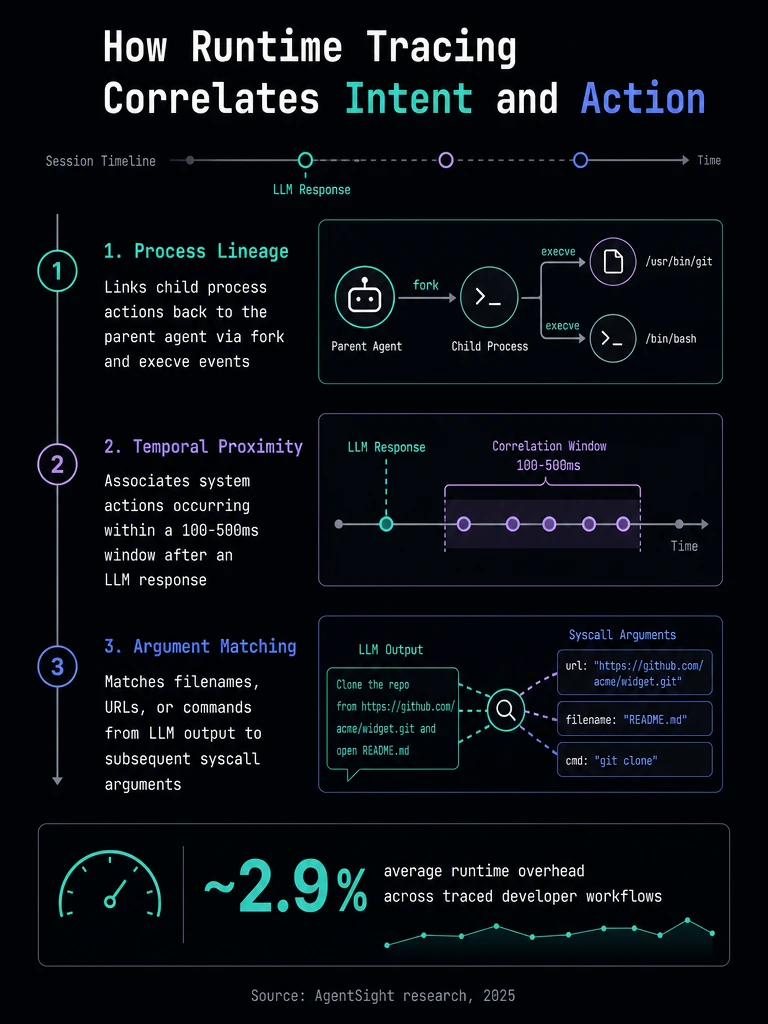
According to the AgentSight paper, this approach is instrumentation-free and framework-agnostic, and the published measurements show an average of roughly 2.9% runtime overhead across the developer workflows tested, with each experiment run multiple times to compare traced and untraced performance. In one documented case, the correlation engine reduced a raw stream of 521 low-level events down to 37 merged, human-reviewable events describing a full attack chain from an initial URL fetch to eventual data exfiltration. That reduction is the real value: a security team doesn't want 521 syscalls to review, it wants the 37-event story of what actually happened and why.
Why Causal Correlation Matters for Long-Horizon Agent Risk
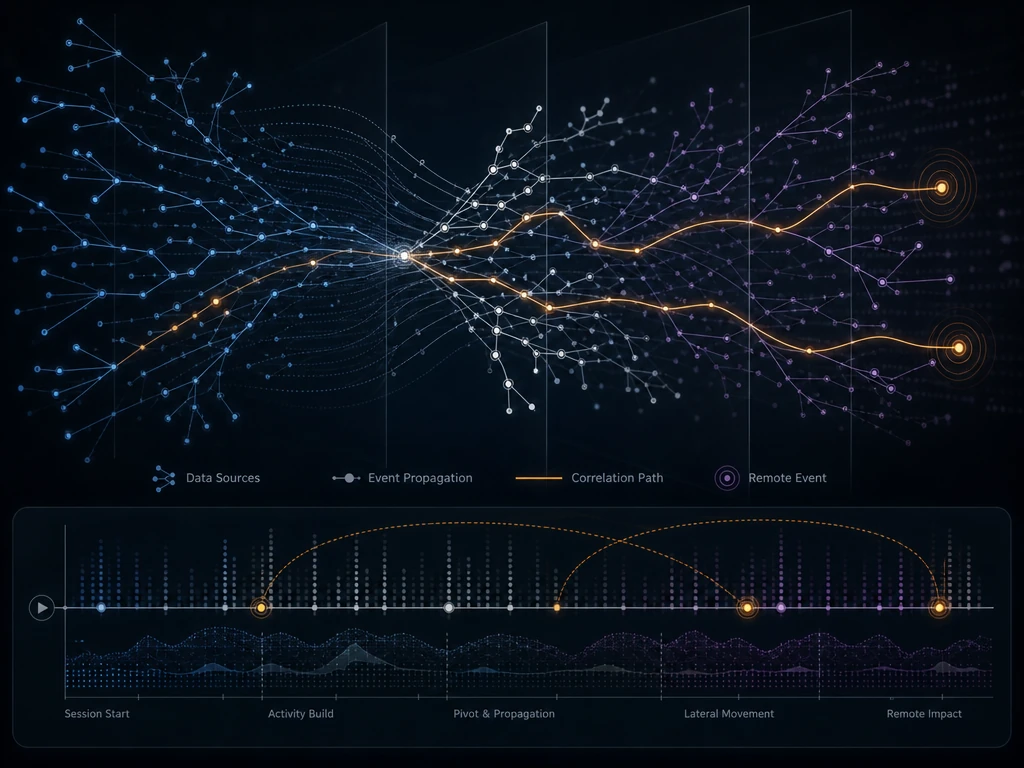
Causal correlation matters because the attacks worth worrying about in agentic coding environments rarely happen in a single step; they unfold across a session, or across sessions, and only the combination of intent and effect makes the pattern visible. A memory-poisoning attempt might plant a instruction in a config file or a long-lived memory store during one session, then have it read and acted on by the same agent, or a different one, hours or days later. Prompt injection delivered through a fetched web page or a pulled dependency can steer an agent's next several tool calls without ever appearing in the original human-authored prompt. Neither an LLM trace alone (which sees the poisoned instruction as just another piece of context) nor a syscall log alone (which sees just another file write) tells the full story. Only the correlated view, "this specific injected instruction led to this specific later system call," gives a defender the lineage they need to act with confidence rather than guess.
This is the layer where runtime control infrastructure like Gensee Crate operates: correlating kernel-level trace data with enforcement decisions across the full span of a multi-step coding session, rather than treating each prompt or each syscall as an isolated event to be judged on its own. In practice we find that the useful unit of defense for coding agents isn't a single tool call, it's the full arc from the moment untrusted content enters an agent's context to whatever it eventually causes the agent to do, sometimes several tool calls or sessions later. That's a materially different problem than filtering a single prompt, which is why long-horizon correlation, not point-in-time inspection, is the design center for this category of defense.
Our analysis of how these attack chains typically unfold suggests the highest-value trace data isn't the busiest event, it's the rare one: the single file write or network call that breaks the pattern of a session's otherwise routine activity, three steps after an untrusted input entered the context.
Runtime Tracing in Enterprise Coding Agent Environments
In enterprise settings, runtime tracing has to work against agents developers already use, feed data into tooling security teams already run, and cover risk that spans an entire session rather than a single command. That's a different bar than a research prototype or a single-host detection rule.
Sidecar Deployment Against Unmodified Agents
Because eBPF-based collection observes kernel events rather than instrumenting application code, it can run as a sidecar alongside coding agents like Claude Code, Codex, or Cursor without requiring an SDK rebuild or any change to how developers already invoke those tools. This matters operationally: security and platform teams don't want to maintain a fork of every coding agent a team adopts, and they don't want tracing coverage to silently break every time a vendor ships an update to their agent's internals. A sidecar model that observes the operating system, rather than hooking the agent's own code, tends to be more resilient to exactly that kind of churn.
From Trace to Enforcement and Recovery
Raw trace data is diagnostic; enterprises also need a way to act on what it reveals. That typically means exporting correlated trace events into existing SIEM and identity tooling so security teams don't have to build a new console, and pairing detection with a way to actually contain or reverse what an agent did. This is where live workspace fork mechanics, forking an agent's work into an isolated branch, inspecting what changed, merging clean work, or rolling back a session where the trace shows an unsafe action, extend what tracing alone can do: tracing tells you what happened and why; a fork, then merge, promote, roll back or discard workflow gives you somewhere to put that information besides an alert queue.
Individual developers evaluating this approach on their own machines can start with Gensee Crate Personal, while organizations that need cross-session risk lineage tied into existing identity, endpoint, MCP, and SIEM tooling typically look at Gensee Crate Enterprise for organization-wide deployment. If you're weighing how this fits into an existing security stack, it's worth talking through the specifics; you can book a demo to walk through how the sidecar model maps onto your current agent deployment.
MCP and Tool-Call Visibility
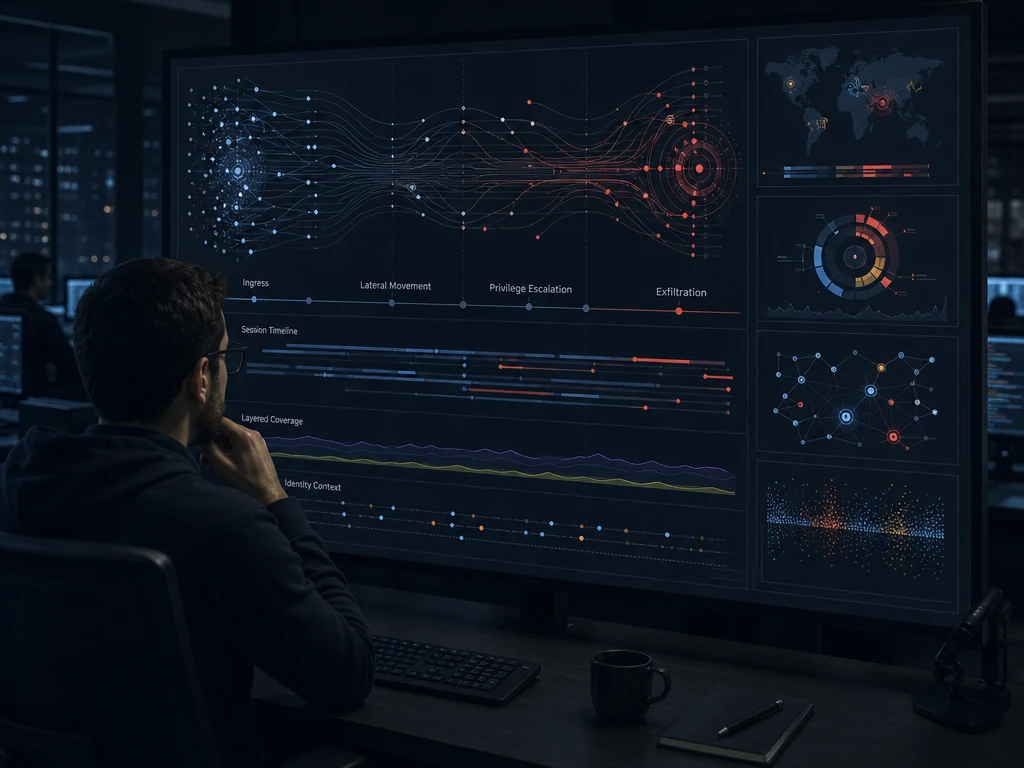
As Model Context Protocol (MCP) servers become the standard way coding agents reach external tools and data sources, runtime tracing has to account for another layer of indirection: an agent's tool call now often triggers a request to an MCP server, which may itself spawn processes or make network calls on the agent's behalf. Process lineage tracking, following fork and execve events, extends naturally to this case, since an MCP server invoked by an agent is still a child process (or a distinct process communicating over a socket) that can be linked back to the session that triggered it. That lineage is what turns "an MCP tool made a network call" into "this specific agent session, driven by this specific instruction, made this specific network call through this MCP tool," which is the level of detail an investigation actually needs.
Implementing Runtime Tracing Without Rebuilding Your Agent Stack
Adopting runtime tracing doesn't require rewriting how your agents are built; it requires deploying collection at the operating-system layer alongside the agents you already run. In practice this looks like three decisions rather than a migration project.
First, choose a collection mechanism appropriate to your environment: eBPF-based tools are the current default for Linux hosts and containers because they avoid kernel module maintenance overhead, while kernel-native mechanisms like Landlock's trace events are worth layering in where you're already using Landlock for sandboxing. Second, decide where correlation happens: some teams want raw event export into an existing SIEM and will build correlation logic downstream, while others want the correlation engine bundled with collection so analysts see merged, causally-linked events rather than a raw stream to reconstruct by hand. Third, plan for export: correlated trace data is only useful if it lands somewhere your security team already looks, which is why compatibility with existing SIEM and identity tooling matters as much as the quality of the correlation itself. Gensee's sidecar components are available as open source on GitHub for teams that want to inspect or extend the collection layer directly, and a deeper implementation walkthrough covering instrumentation specifics lives on the Gensee blog.
Tip: If you're evaluating vendors for this category, ask specifically how they correlate LLM intent with system-level effects, not just whether they collect syscalls. Collection without correlation still leaves you reconstructing the attack chain by hand.
FAQ
What is agent tracing?
Agent tracing usually refers to application-level observability that captures an AI agent's prompts, tool calls, and model outputs as it runs, similar to how distributed tracing works for microservices. It's distinct from AI agent runtime tracing, which observes what happens at the operating-system level (processes, files, network calls) and correlates that activity back to the agent's stated intent.
How is runtime tracing different from standard API gateway logging?
Standard gateway logging captures HTTP request and response metadata at the network edge, while runtime tracing captures what happens inside the machine after an agent's tool call or command actually executes. Gateway logs can tell you a call was made; runtime tracing can tell you what that call caused a process to do on disk or over the network.
Does runtime tracing require changes to agent code?
No. eBPF-based runtime tracing is instrumentation-free and observes kernel events rather than hooking application code, so it works against unmodified coding agents and doesn't require an SDK rebuild. This also makes it more resilient when an agent vendor changes internal APIs, since the tracing layer never depended on those APIs in the first place.
Can runtime trace data be exported to existing observability backends?
Yes, correlated runtime trace events are typically structured so they can be exported into existing SIEM, identity, and observability tooling rather than requiring a separate console. This is the practical requirement for enterprise adoption: security teams need trace data to land where they already investigate incidents.
How does agent identity flow into runtime traces?
Agent identity flows through process lineage: as a coding agent forks child processes or invokes tools via MCP, each subsequent process or call can be traced back through fork and execve events to the original parent agent session. That lineage is what lets a correlated trace attribute a specific system-level action to a specific agent, session, and originating instruction rather than an anonymous process.
Conclusion
AI agent runtime tracing fills a gap that neither application logs nor LLM observability traces were built to close: seeing what a coding agent's processes actually did at the operating-system level and tying that back to the intent that caused it. eBPF-based collection makes this practical without touching agent code, and causal correlation methods, process lineage, temporal proximity, and argument matching, turn a flood of low-level events into a readable account of what happened and why. That combination is what makes multi-step risks like memory poisoning and prompt injection visible in the first place, since neither the poisoned instruction nor the resulting system call looks suspicious in isolation.
If your team is evaluating how runtime tracing fits into an existing coding-agent deployment, alongside identity, endpoint, and SIEM tooling you already run, booking a demo is a practical next step, or drop into Discord to compare notes with other teams working through the same questions.